

Going for a walk is one of the simple pleasures in life. Here in Great Britain we are blessed with some extraordinary landscapes, national parks and countryside that are just waiting to be explored. Being able to read a map and really enhance that experience.
A map offers an eagles eye view of an area, offering inspiration for new places to go. Being able to read a map is, in my humble opinion, a vital life skill that we should all aim to have and practice. A GPS or mobile phone are all very well but … a good old paper map doesn’t require a battery or signal to work.
Which map is right for me?
For a walker, we’re generally looking at one of several options for a paper map in the UK. There’s Ordnance Survey maps – the orange one (OS Explorer) and the pink one (OS Landranger). These are available for every single part of Great Britain. The difference between the two is the scale. The OS Explorer map is at 1:25 000 scale and the OS Landranger is at 1:50 000 scale. This means that what you see on the map is 25,000 times and 50,000 times respectively larger in real life. Or to put it another way – 1 kilometer on the ground is the equivalent of 4cm on the OS Explorer and 2cm on the OS Landranger.
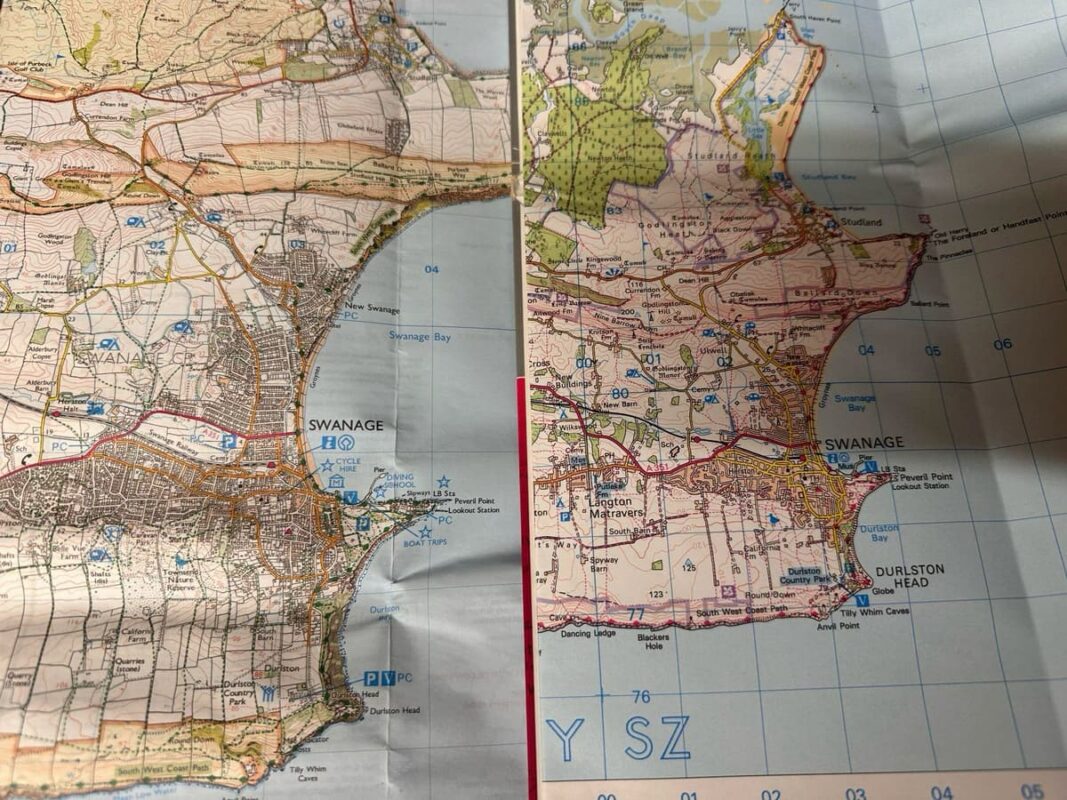
This image shows the difference in detail you get on an OS Explorer Map (on the left) and an OS Landrange Map (on the right).
OS Explorer maps will offer you much more detail – they will show you footpaths, bridleways and cycle paths. They’re perfect for walkers, cyclists and horseriders.
OS Landranger maps don’t have quite as much detail to them – but will show the essentials. They cover a much larger area. These are a popular choice for cyclists looking to travel further distances, and those exploring in a car. This is also a popular scale of map for those walking in vast open space such as the Highlands of Scotland as you can see a wider area on your map.
Another popular choice are the maps from Harveys. These are at a scale of 1:40 000. These are a popular choice for those walking in hills and mountainous areas as you can see a wider area on the map itself. There is also relief shading on areas of elevation which help bring the map to life even more.
What is my map telling me?
Regardless of which map you choose – there will be a variety of symbols and icons to help show you what is in that area. Some of the symbols used match what the object is in real life – for example windmills, castles and trees. Tourist information symbols are in blue – you can see lots of examples on this extract of mapping:
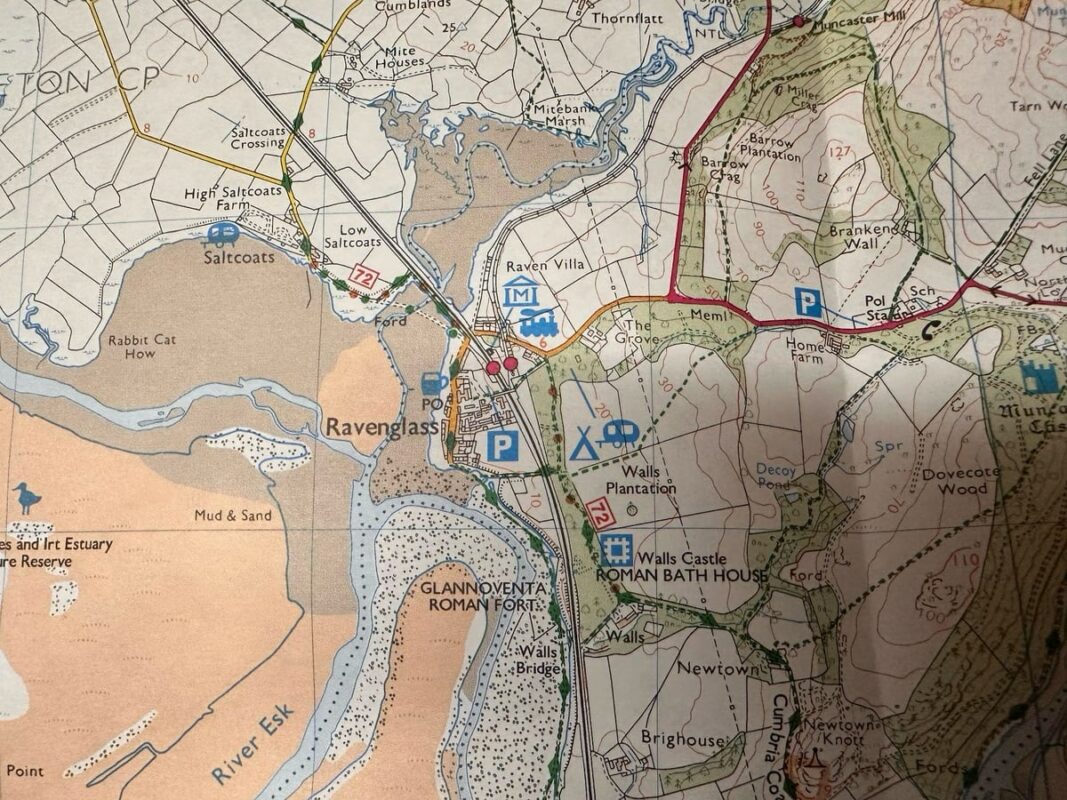
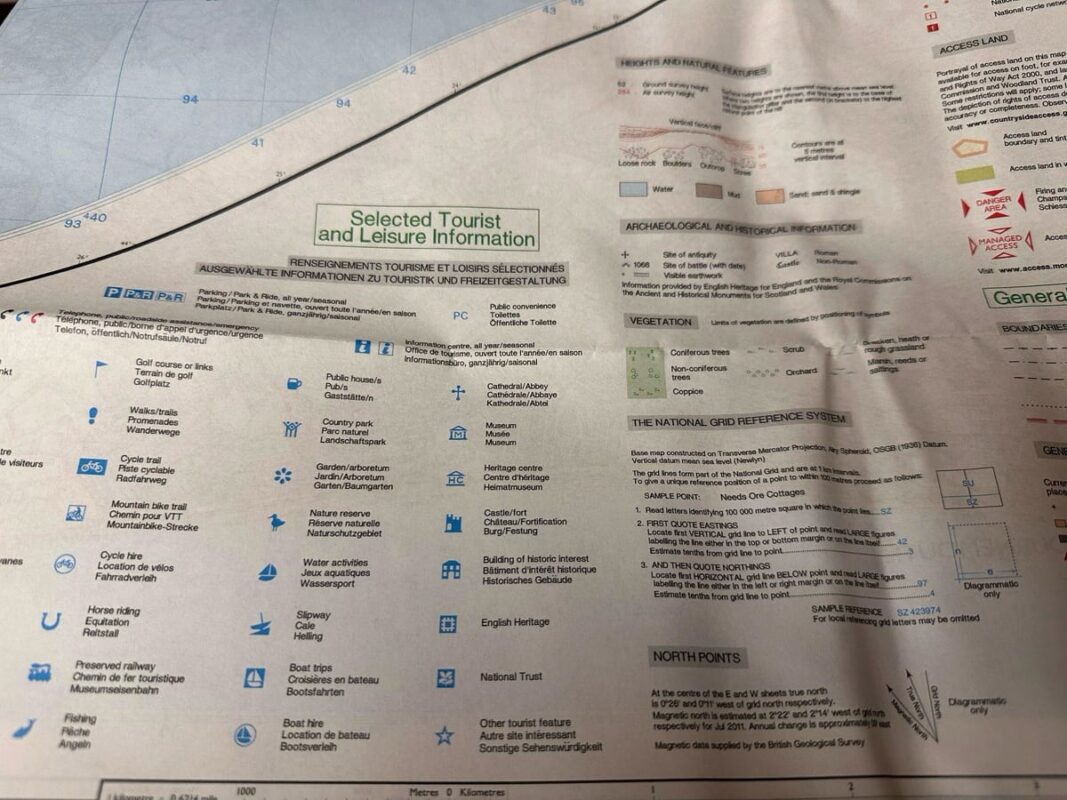
Many symbols are straightforward, others though can be a little more cryptic – but alongside your map you will also find a map legend which shows what each symbol means. The legend will also show you the classification of roads, footpaths and rights of way, types of vegetation, boundary lines and tourist information.
Across the map you will notice some orange swirly lines. These are contour lines and each line follows land at the same height. If you follow the lines round, you will come to numbers on them. This number is the number of meters above sea level. When you look at the number, the top of the number is at the top of the slope. Where contour lines are close together, it means that it’s very steep. On Ordnance Survey maps, in most places the lines denote a difference of 10 metres between the two. However in some part of the country where the land is much flatter (like the Norfolk Broads for example) you’ll notice that the numbers shown are in increments of 5 metres instead (if they were 10 metres everywhere it would look very flat!).
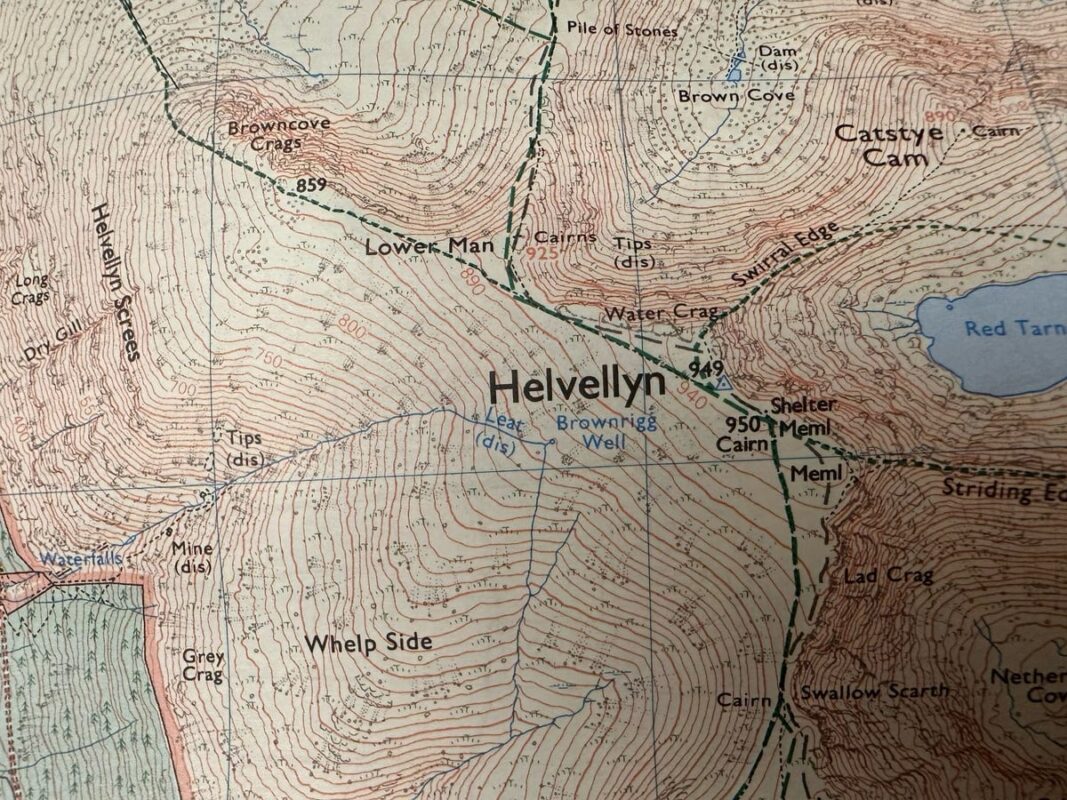
On this example of Helvellyn, we can see that the slope is much steeper by Lad Crag than it is at Whelp Side for example due to the difference in space between the contour lines.
Understanding grid references
Across your map you will notice a grid of even squares that are overlaid on the map. This grid helps you pinpoint where something is. Helpfully, the grid squares help link to the scale of the map. On an OS Explorer map, for example, each grid square is 4cm (so the equivalent of 1km on the ground. On an OS Landranger map they are 2cm (again, the equivalent of 1km on the ground).
Each grid line, whether running horizontally or vertically will have a number on it (it will either be at the top, bottom or midway point of your paper map). The lines that run from top to bottom are called Eastings (this is because the number increases the further east you travel). The lines that run from left to right are called Northings (this is because the number increases the further north you go).
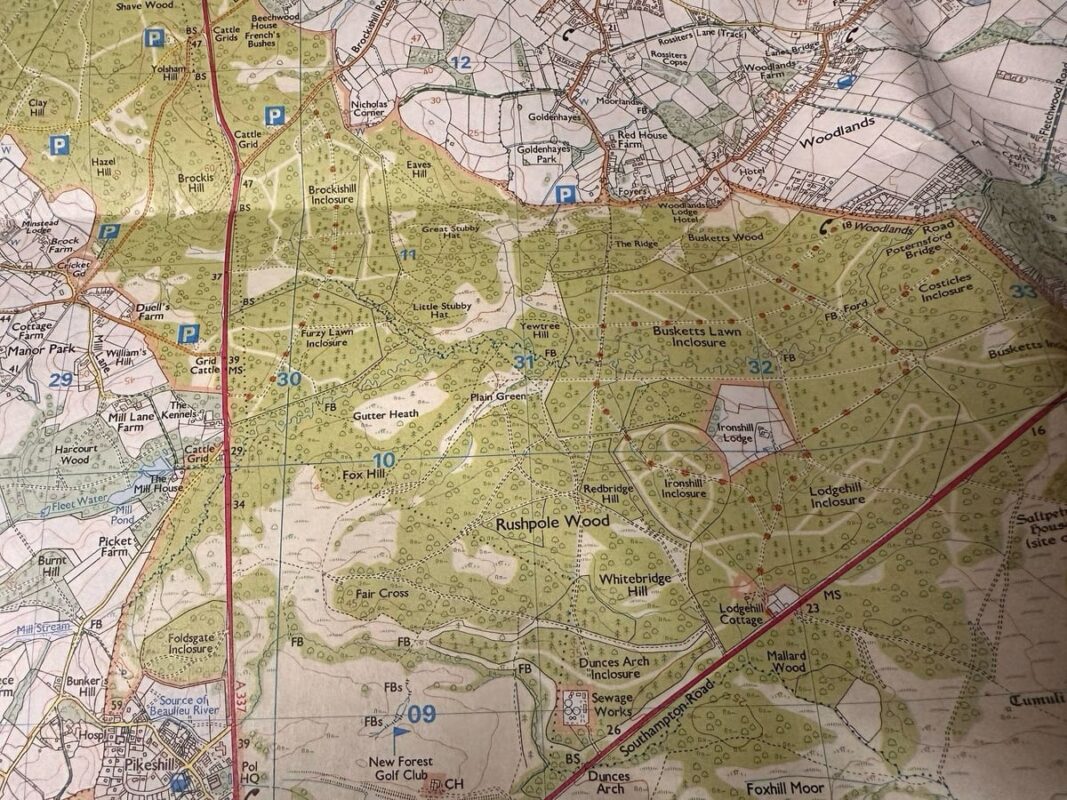
We can use these numbers to help pinpoint where something is by creating a grid reference. What we need to do is look for the numbers of the lines that meet in the bottom left corner, taking the easting number first and then the northing. This will give us a four figure grid reference. Using the above as an example – if we wanted to give a grid reference for Little Stubby Hat we would say it was in 3010.
A four figure grid reference pin points a 1km square plot of land. If you need Mountain Rescue to find you, for example or are arranging a place to meet up with friends, you will want to narrow down that square even further. We can do this by creating a six figure grid reference.
What you need to do is imagine that the grid square you are in is split down again into smaller squares – a 10×10 grid. Each of those boxes we assign a number – starting with 0 in the bottom left and going up to 9. Again we first take our easting number and then we add to that the number of the box running left to right. Next we add our northing number and add the equivalent number of the box moving from the bottom to the top. This gives us a six figure grid reference which pinpoints a 100m square box – a much smaller area for someone to find you in. Again, using the example above of Little Stubby Hat that would be 307107.
Depending on the type of compass you have with you – you might find that the baseplate has some markings on it that splits the grid square on commonly used maps (OS Explorer, OS Landranger) into the 10 sections to help you create your six figure grid reference.
Great Britain is broken down into 100km square boxes on mapping. This means that every 100km a grid reference is repeated. So how do you pinpoint which 100km square you are in? Easy! Each of those 100km squares has been assigned a prefix of two letters. These letters can be found in each corner of your paper map (and mid-map if your map crosses multiple blocks). When you add these letters to the start of your six figure grid reference you have narrowed down the location to a precise 100m square block.
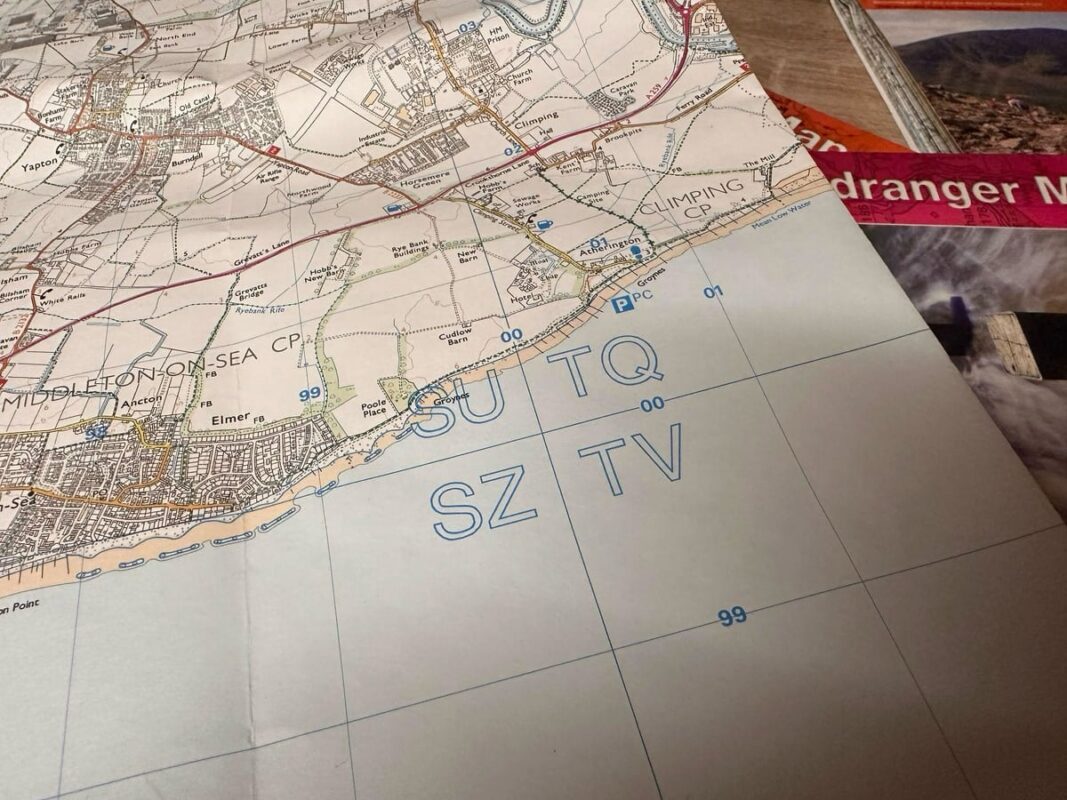
So in the above example Poole Place is found at SU993003.
So there you have it – now you know what your map is telling you and how to create a grid reference. Now you go outside and explore the wonders of the great outdoors!
You can buy paper maps of Great Britain online from the Ordnance Survey map shop.